Note: The speaker is speaking to a group of people who already know the terms and have experience in trading commodities or know about charts and shares and markets. I found it hard to understand a lot of ideas and terms and could not go through describing them all so I suggest keeping a separate tab open to search for what doesn’t make sense.
Belief > action > result cycle.

– The most important part of trading is your processes and having faith in your processes.
– You’ll make losses. Making a profit is hard because you never know when to get out.
– Some points
1 – Do one thing… and do it well. Speaker does breakouts well.
2 – Patience, it’s more important than discipline.
3 – Let the trade come to you. You’ll get more trades than you can handle so you have to pick the one you can handle.
4 – Create/develop your own trading style.
– You have to repeat something for 3-6 months to learn something.
– Buffet has time on his side. He holds a trade for ages. Soros maximises his dollars.
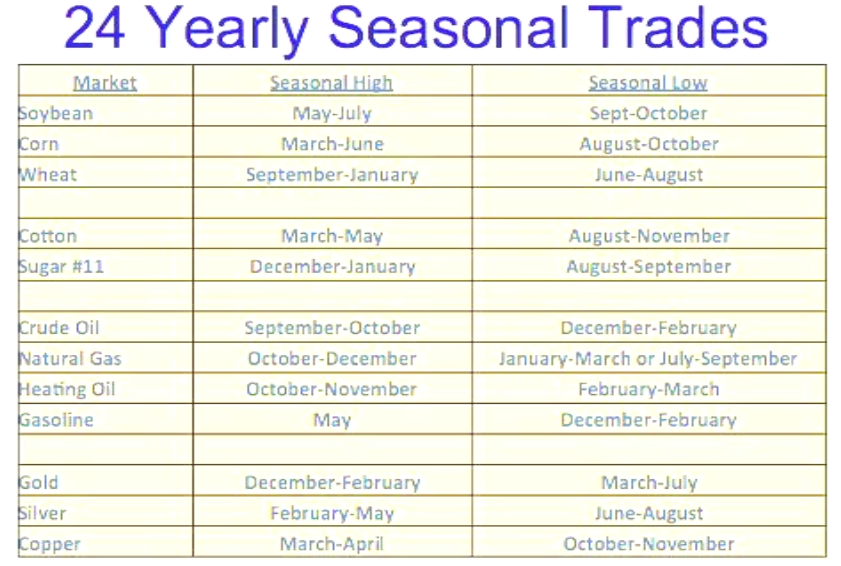
– Understanding commodities. Study of reoccurring or seasonal periods or of supply and demand imbalances.
Market Types:
2 Based on production cycles – Annual are supply sensitive (coffee, sugar, cotton) and perpetual are demand sensitive (oil, natural gas, etc).
1 based on economic cycles – Financial (tend to be forced by economic cycle.
Commodities are priced according to their sensitivty to a variety of factors.
Financial markets have a high degree of sensitivity to the economic business cycle.
1. Stock indices – Consumer and business confidence and spending (leads to compnay profits?)
2. Bonds markets – Inflation and interest rate movements (Central bank monetary policy)
3. Currency markets – Those factors that can drive the value of the domestic currency (Interest rates, economic health, surplus or deficit).
The Bubble – The risk to the Australian dollar is China’s bubble. China is spending a lot of money to get the economy going. There is no real basis for it and creating a bubble that will explode. They’re building hand over fist and people don’t want to move there.
The number one source to read is the price section. Learn to read price and you’ll learn to read charts.
In the annual cycle you have 6 months to grow and 6 months to sell. Demand and price will play a part in the selling.
24 Yearly Seasonal Trades
For agricultural commodities: Know when the crop is planted (usually the time for the highest prices). Know when the crop is harvested (usually the time of lowest prices). Bananas wiped out because of a cyclone the prices shot up, the next year it dropped as bananas grow yearly.
You’ll make most of your money with a dozen trades a year.
For annual commodities: Do we have enough supply?
1. Planting season.
2. Harvest season.
3. Carry-over stock.
For year-round commodities. Where is the demand coming from?
1. Wholesale inventory build cycle.
2. Seasonal demand. a) Heated oil. b) Copper. (Focus on wholesale price not retail).
Seasonal patterns in Financial markets.
– Economic conditions (broadly)
– Central bank monetary policy cycle. Quick way to find a currency trade? a) Which central bank is raising rates and b) which central bank is cutting rates.
Audience asks a question about what Rolling means
Say a deliverable contract like grains. Different countries have different processes. In America they have delivery points which the farmer has to deliver what he’s been paid for. The exchange on a given day which is called first notice day allocates randomly an election notice which would say so and so will deliver certain amount between now and say, 7 days time. First notice is due to expire. You can’t hold a contract past either the first notice day or the expiry date (7 days time). Now, we have the near/nearby/spot month which is the current/most active contract in a market. So if you’re going to pyramid into a trade you look at if you’re going to pyramid into the spot month or a back month (technically it means spot +1, spot +2, spot +3). So when you roll, you can roll in a few ways. 1 – Get out of the contract and simultaneously buy/sell another one. 2 – Get out of the contract in June and wait for a technical signal in August. 3 – You might get a technical signal before you have to get out of your current contract so you can sell an August contract and maintain a short in your June until you have to get out of it. That way when you get out of June you’re still short in August (clear as mud).
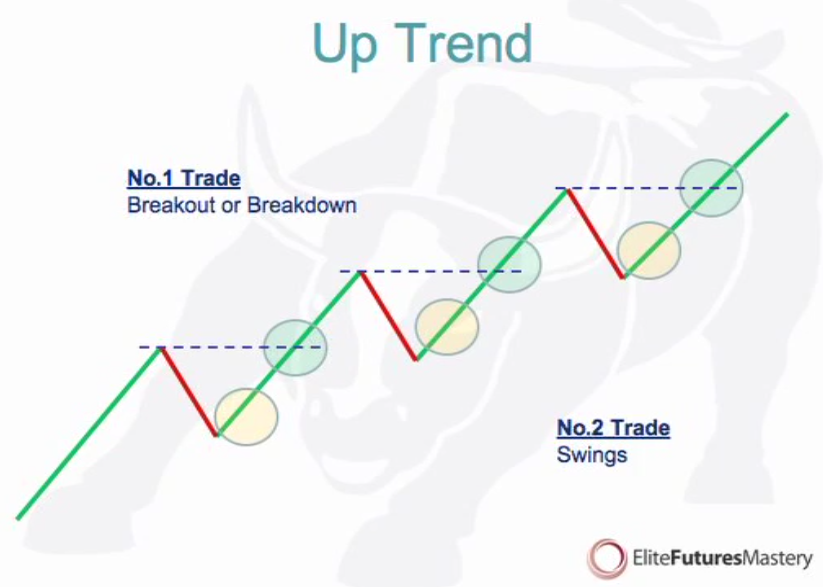
In the above image, the speaker’s number one trade is where the dotted line joins the top cicle in every uptrend, but could be different for different people. His number 2 trades are the circles below them. Look for those patterns. Look up ABC Trade coined by Gann.
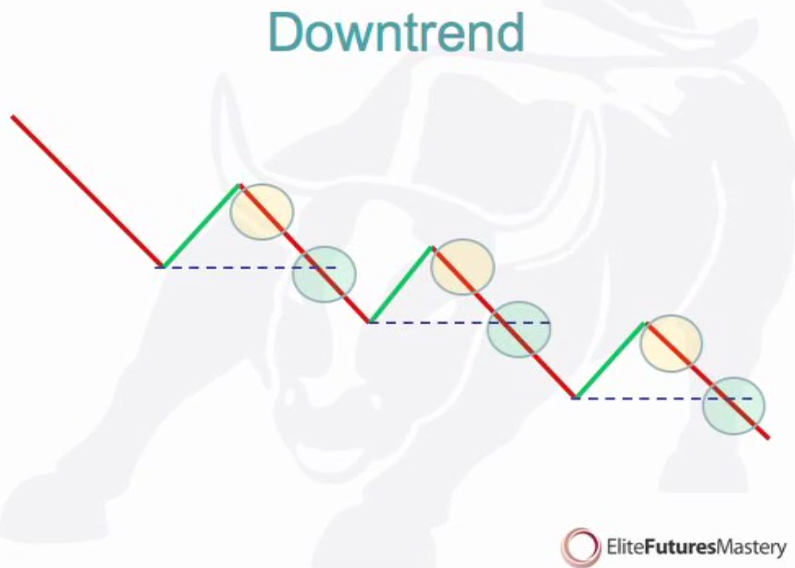
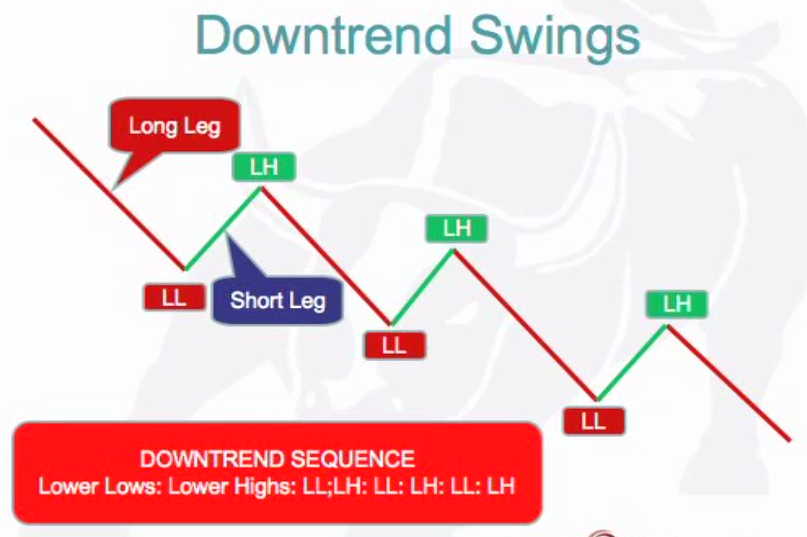
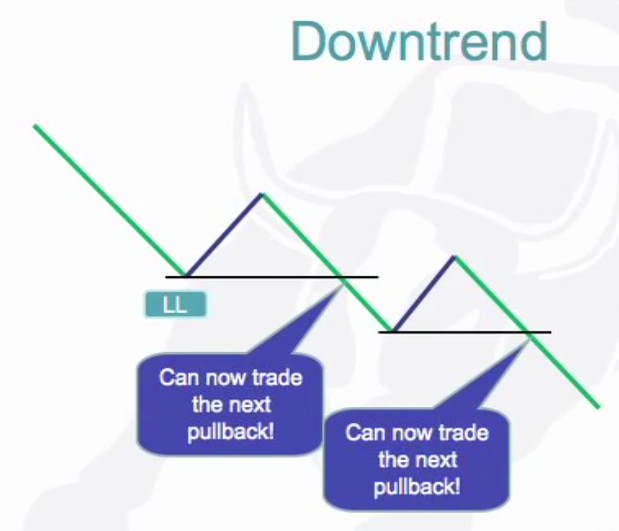
Again, in a downtrend, the speaker’s number one trade is to always take circle with the dotted line. He’s not afraid to buy highs, and sell lows. He likes to buy markets that a rising and sell markets that are falling.
The market price of anything is the last traded price. If you want to buy into the market with a limit order, you’d place your buy order below the market, which is the limit you’re prepared to pay. You buy it cheaper than the current price. If you want to sell for more than the market, you limit order will be more than the current price. If you place a limit order above the market it will get filled immediately. A buy stop is a resting market order. When the stop order is traded, your stop order turns into a market order and is filled immediately. But until then your stop order will stay resting in the market place. You could use a buy limit order when you want to get a cheaper price (called ‘trying to pick a bottom’). Buy limiter orders can be used to take a profit too. A sell stop can be used to break out trade to the downside or as a stop loss order (it stops loss but if it’s making you a profit the sell stop is called a trailing stop).
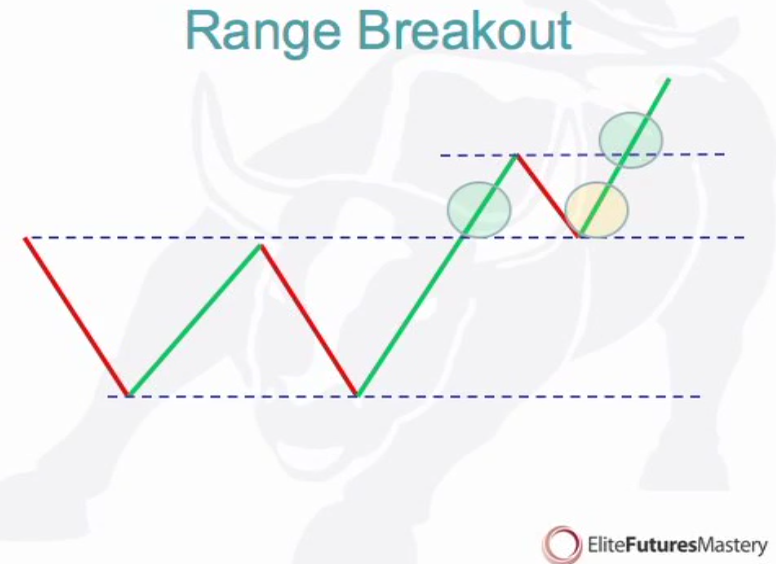
If you’re going to trade in a range breakout you’d trade in the above 3 places. You’d especially trade in the 2 green circles while have a strategy in the yellow swing.
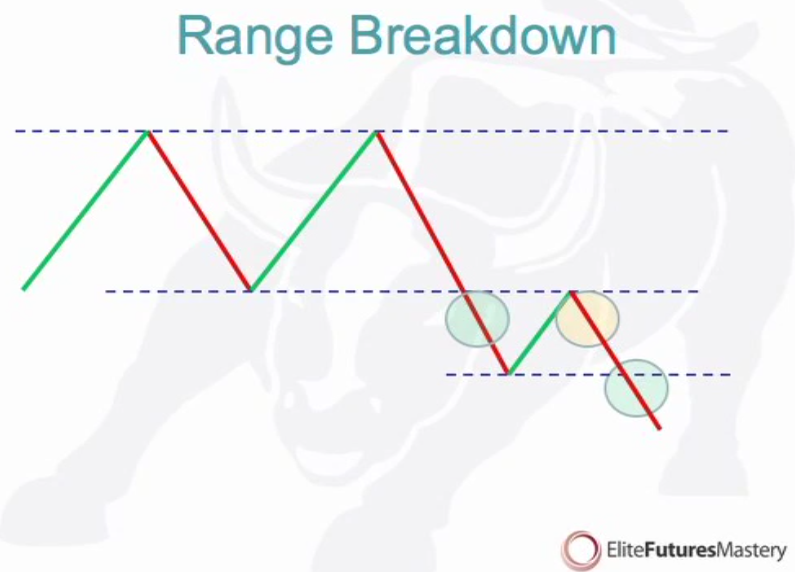
In a break down you’d do the same with. And the yellow circle is called a pullback.
Take as many points out of a trade as possible
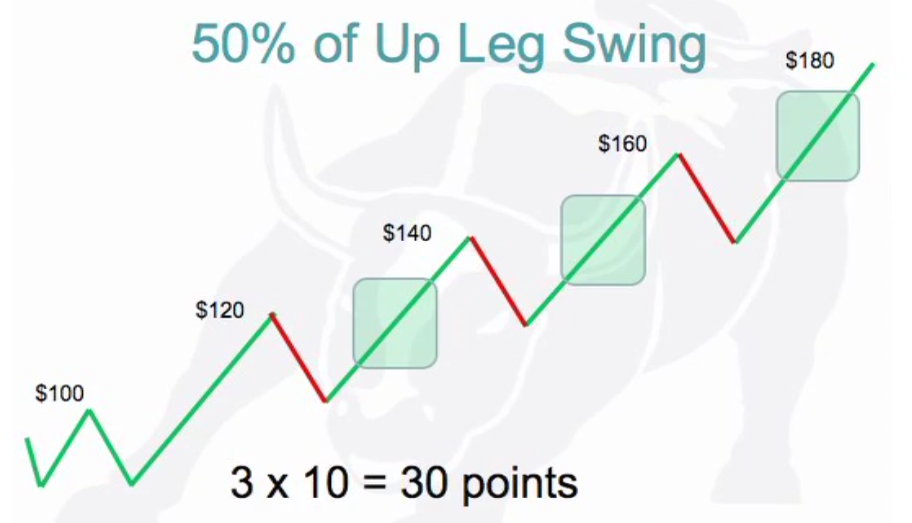
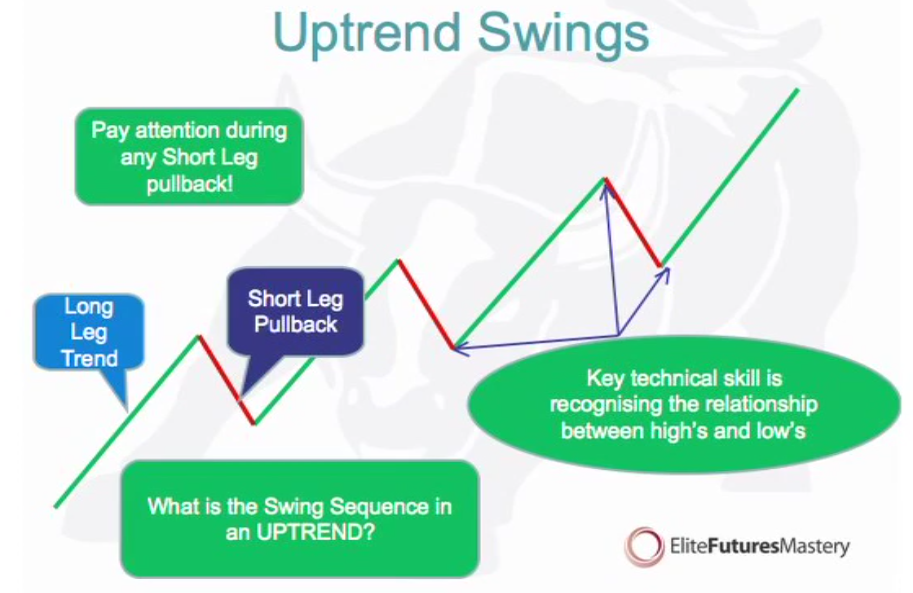
In the above swing trade the green lines going up are the long legs and red are short legs. In an uptrend you trade the long. Take only 50% of the long legs. Get in low and out a little bit higher. 50% in this case is 3 lots of 10 points so 30 points.
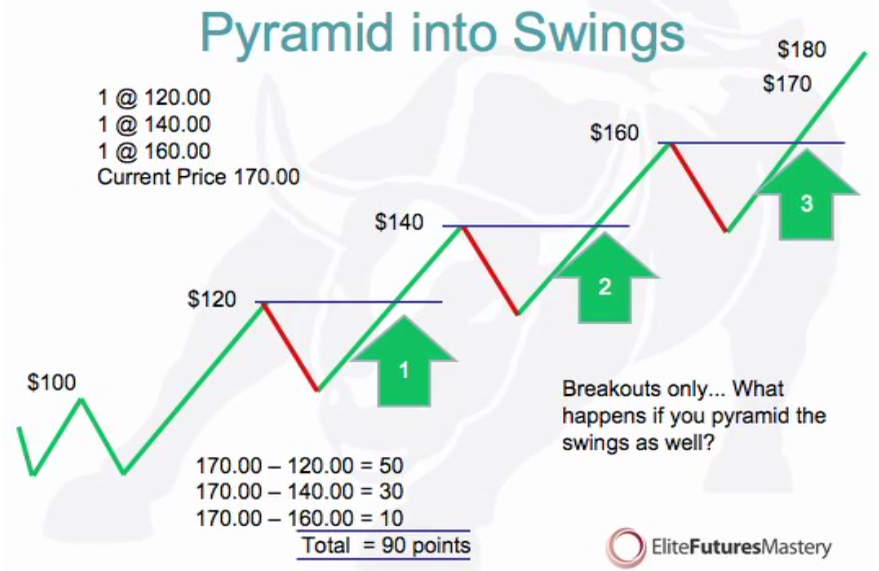
Now you can pyramid into a swing. You take the breakout trades where the blue lines are. Remember to put your stops at the bottom of each red line.
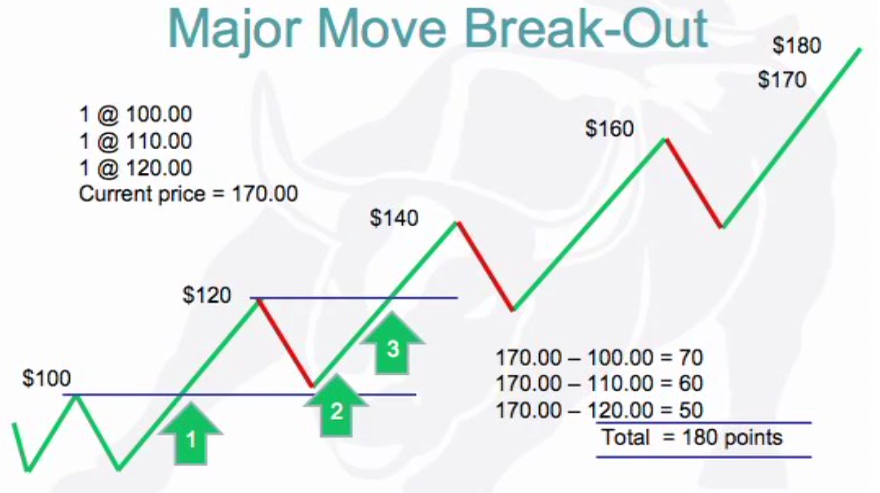
Everytime there is a break out it’s going higher than the previous trend so you buy there. The difference between this one and the previous trades above is that here there is a pyramiding into a trend while the others are pyramiding into a breakout.
Risk strategies are called ATR because it’s a volatility based stop loss called the chandelier exit and logical levels.
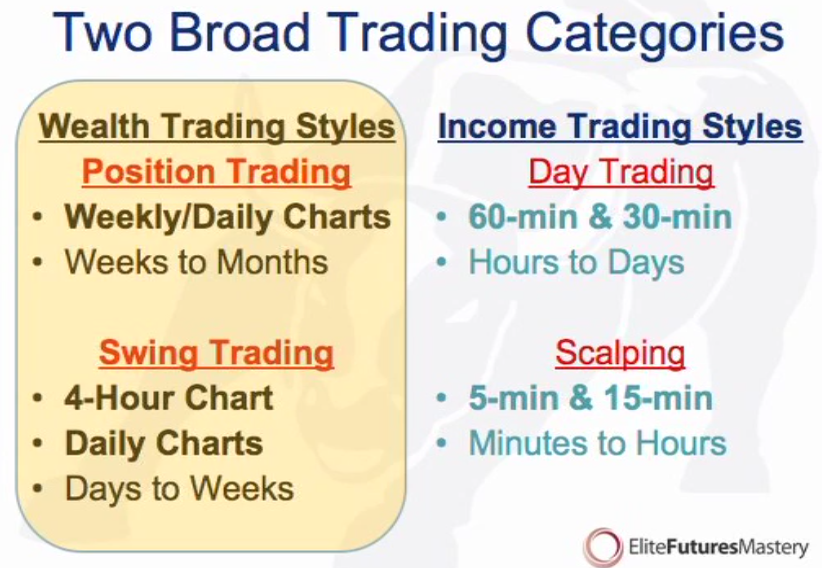
For optimum results traders should have 1) a wealth building trade and 2) an income producing trade on at all times.
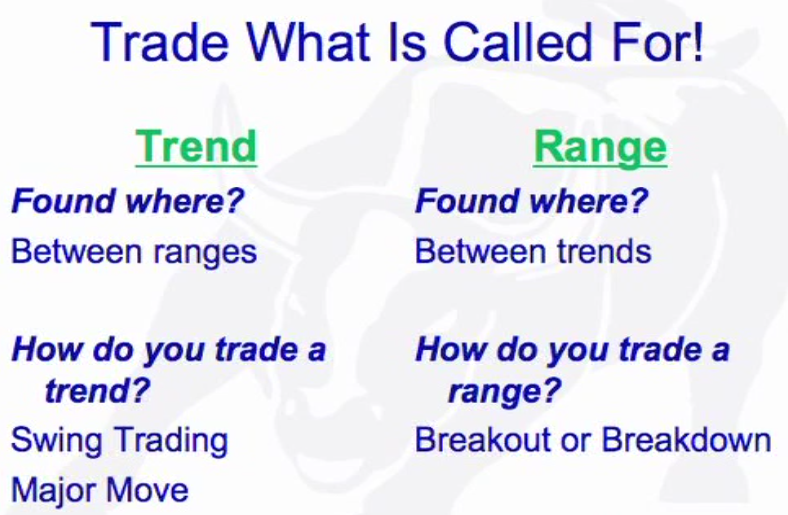
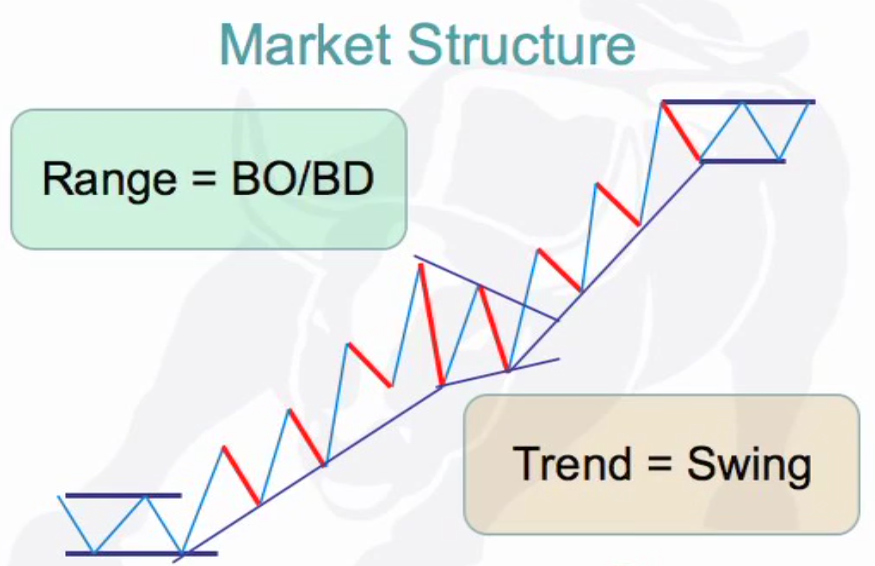
Another word for a range is pattern. A range is found between trends. Trend, range, trend, range. E.g. copper, euro, gold, corn, wheat, soy, etc. Trend or Range? 1st thing you need to do is decide if the market is trending or ranging. Then you can choose the correct method of trading the market. When trending always sell at the level it hit the lowest point (break down). Refer to the above 3 possible trades in the green and yellow circles. (Speaker shows different charts to see what trades can be made in various trends).
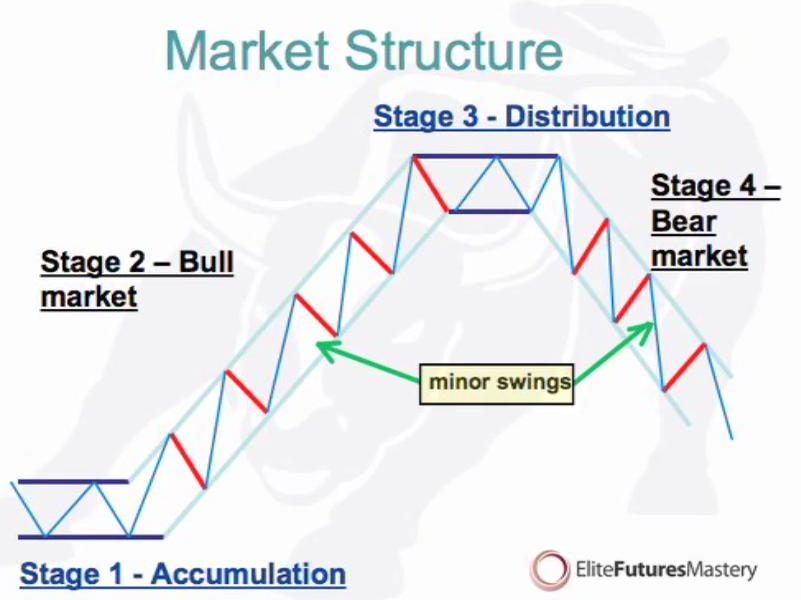
Best places to buy is start of stage 2 and sell at start of stage 4.
You’re looking for breakout, swing, break, swing, etc at each stage depending on stage.
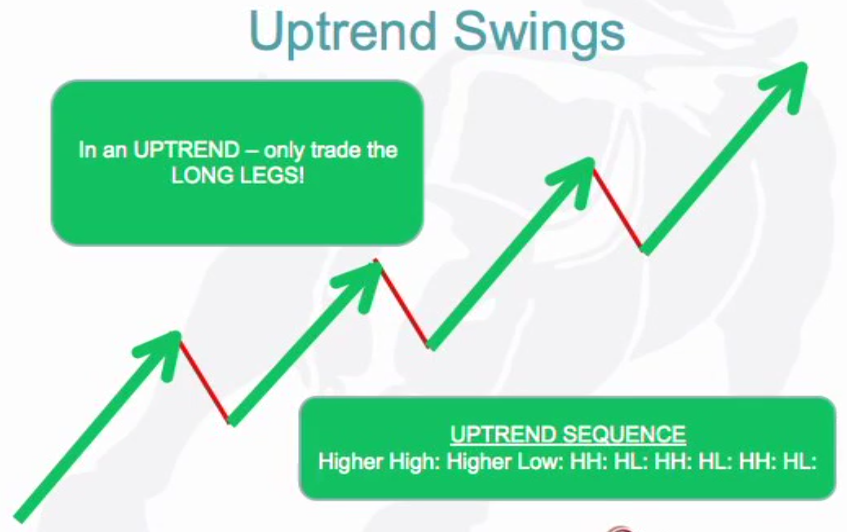
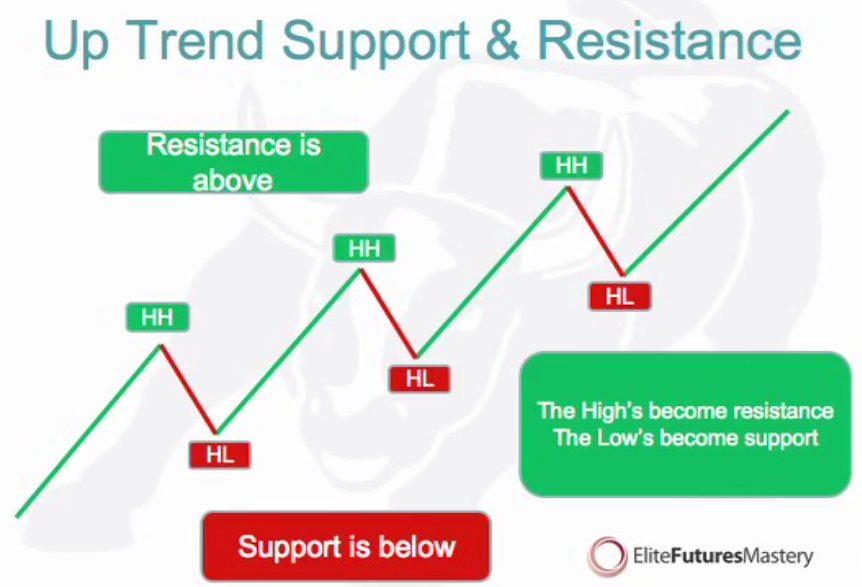
Market swings. The market is always moving between making highs and lows. After every high is made we immediately turn our attention to where the next low is going to be made. After every low is made we immediately look for where the next high will be made.
A core concept of technical analysis is the relationship between the swing highs and the swing lows. The movement between the swing highs and swing lows are the first indication that the trend may be changing or emerging.
Indicators are good but if you can’t read price action all the other information is useless. All you need is price action. Everything else is derived out of price.
Usually to make money you need to buy low sell high but in futures you can sell high first then buy low. You’re basically trading a price difference. If you want to go short you sell first and buy back at a lower price, if you want to go long buy first and sell at a higher price. The best strategy is to limit your losses, after a certain amount of loss you won’t go any lower.
There is always a price in every chart where you will be a buyer and a price you will be a seller. You just need to know these prices. If price trades above resistance – breakout. If price trades below support – breakdown. Both the breakout and breakdown are primary places to enter a trade. The first thing you need to do is identify support and resistance so you can identify these primary places. Trade these in all timeframes as they are the primary source of income.
He talks about chart patterns like ‘head and shoulders’ and there are many patterns like them that traders use. Below is also a video on how to read the candlesticks. When looking at candlesticks if you see a trend in the selling bars where they are wider or stronger than the buying it means that the buyers are not strong enough to break the down trend.
Pre-framing: In kino 6 and 16 keep coming up. That is what he told his friend and then the friend started seeing. It’s like reticulation activation system. Buy a red car you see red cars everywhere kinda thing.
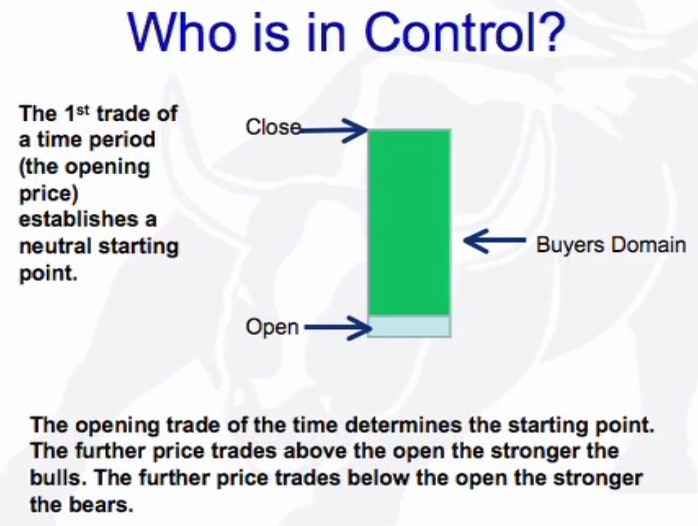
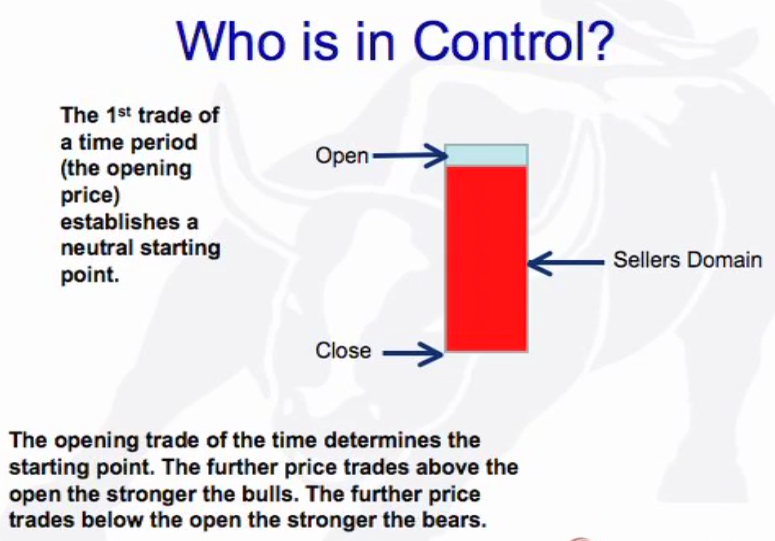
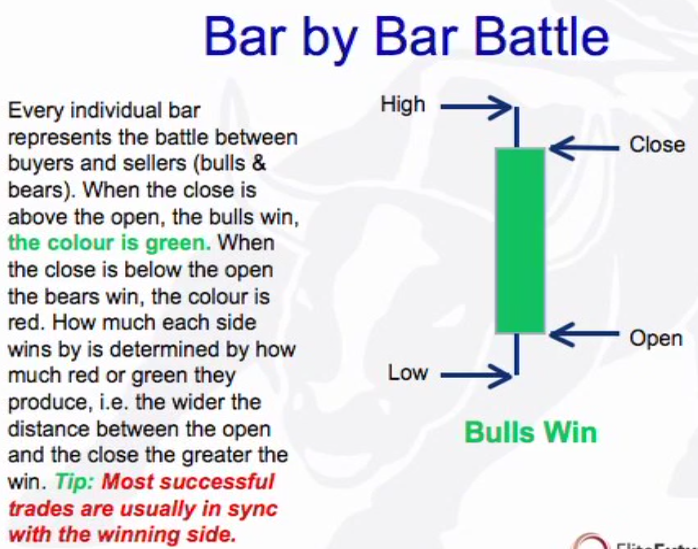
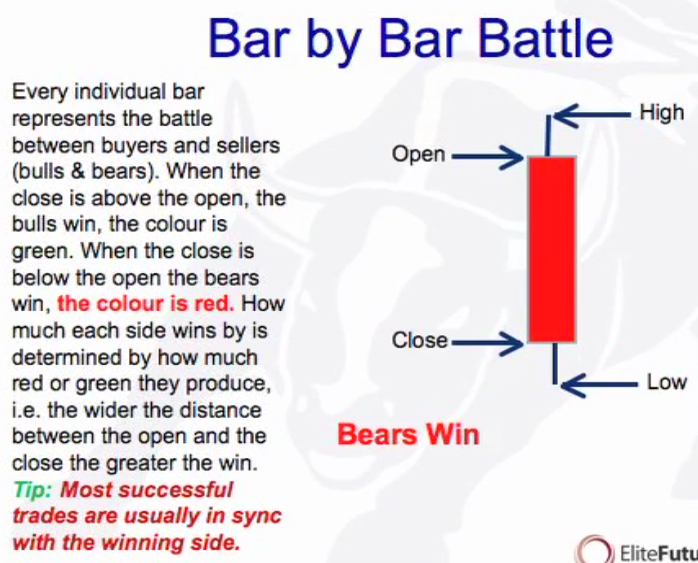
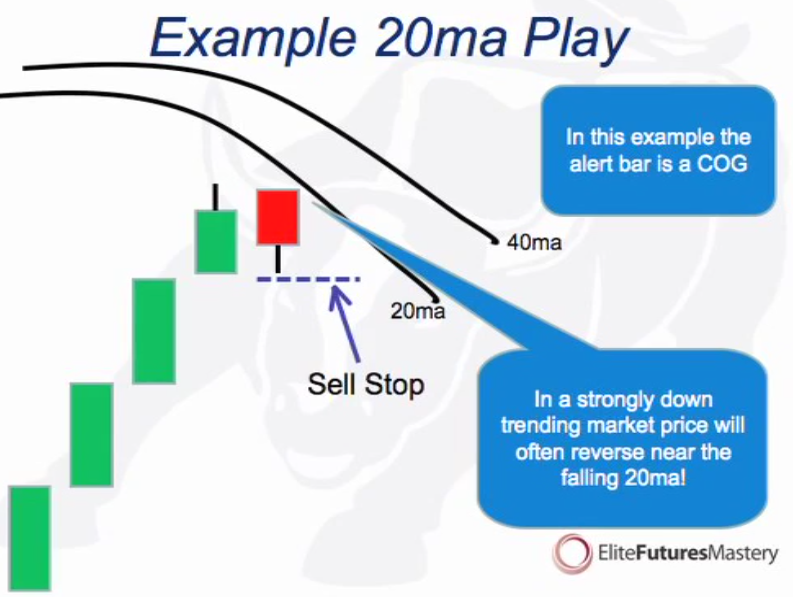
Open: Neutral starting point of every bar. All activity above the bar (green) is buyers domain and all activity below is sellers (red) domain. The further the price sells below the open the stronger the sellers (bear trend) and if above then stroner the buyers (bull trend). There is also the pig and the chicken.
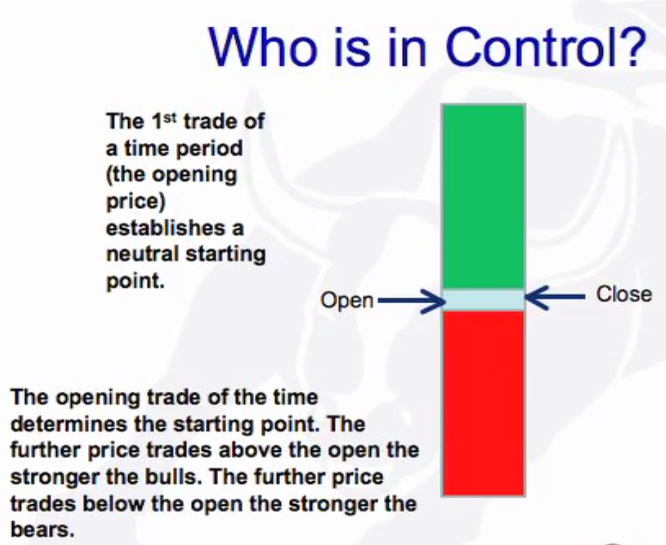
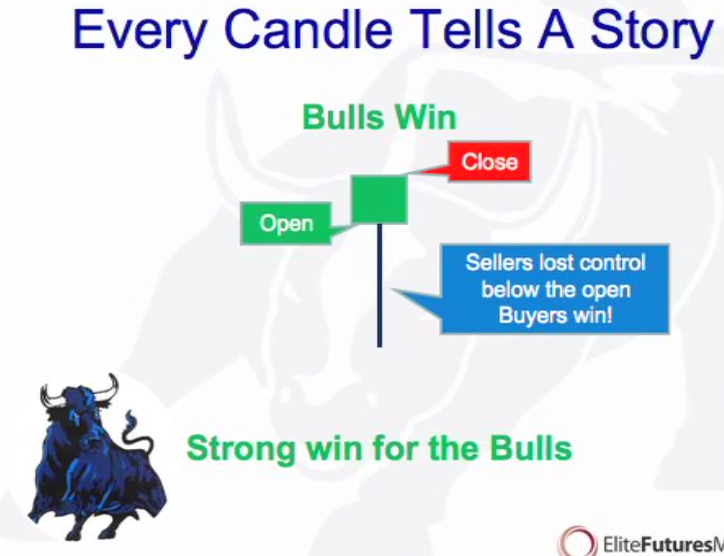
In this case even though the buyers won, the sellers managed to drop the price very low before the buyers won. That is a buying tail. Same can work for the opposite story.
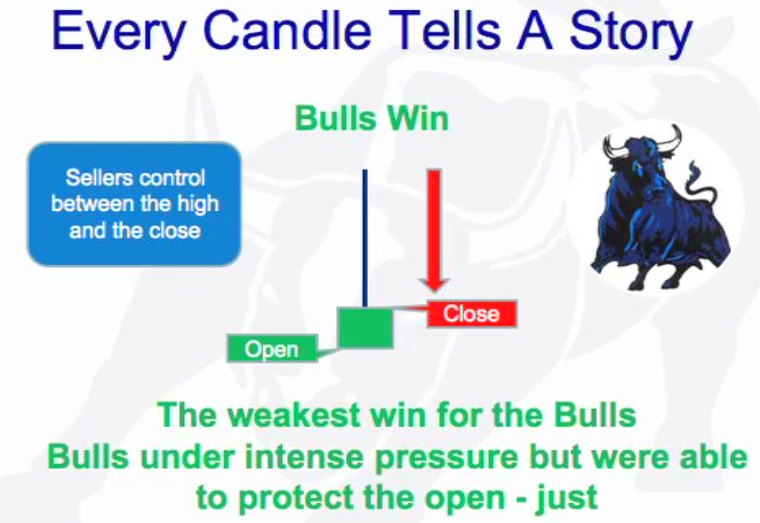
The buyers may have won but the sellers were able to drop the price so much lower. So who really won?
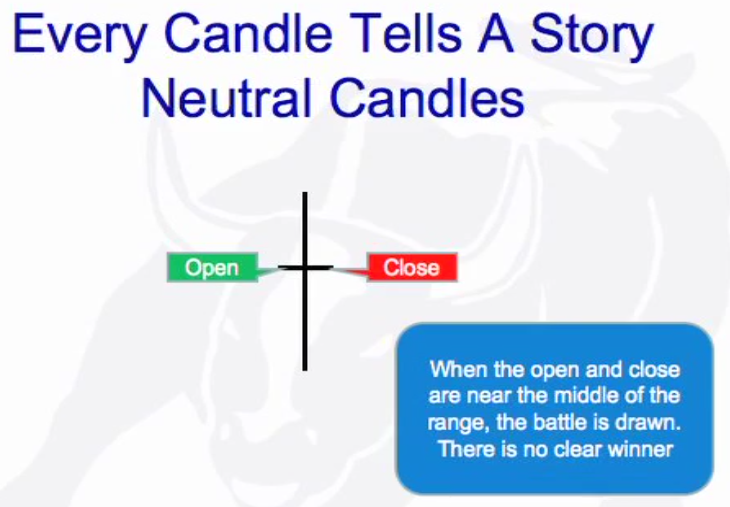
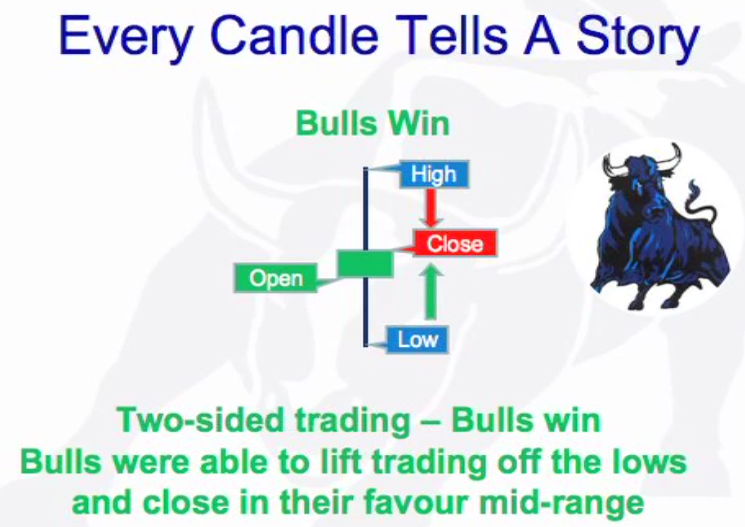
The above are the main charts you’ll see or an opposite version of them.
Mentions Gann Swing so added below video: Using Gann’s Swing Charts To Trade Aconex
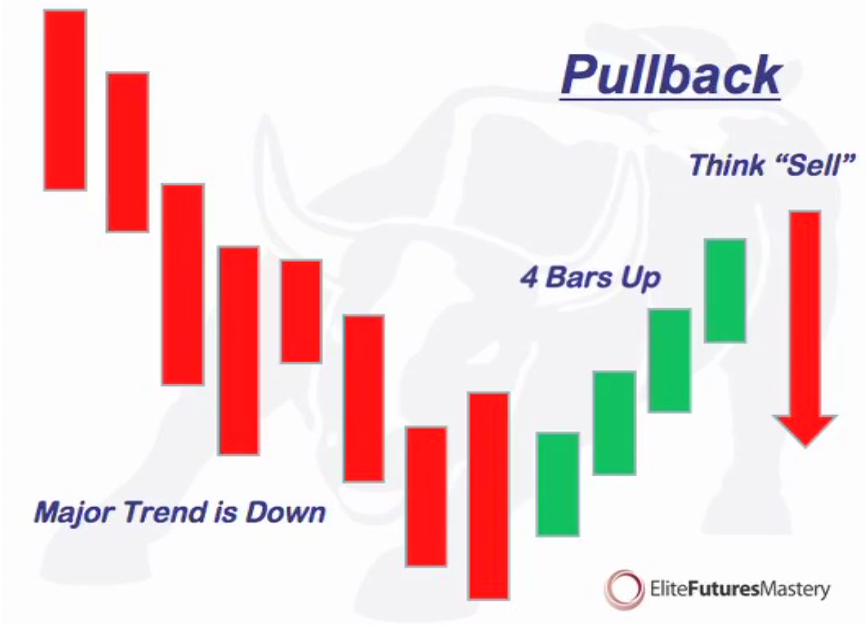
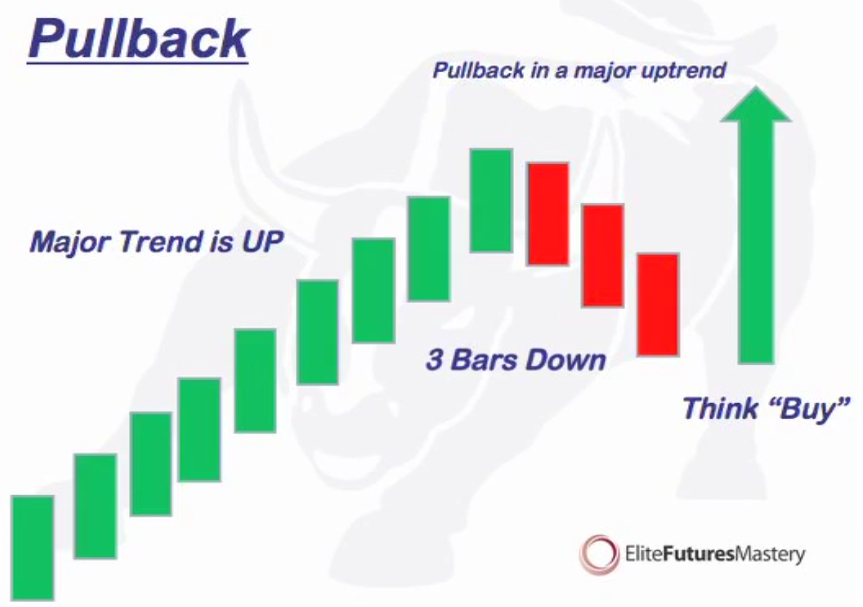
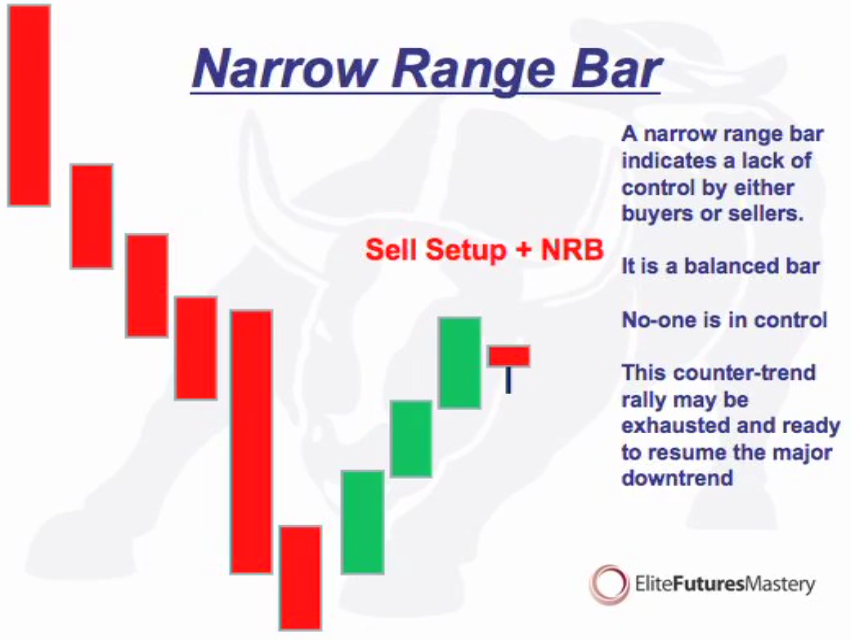
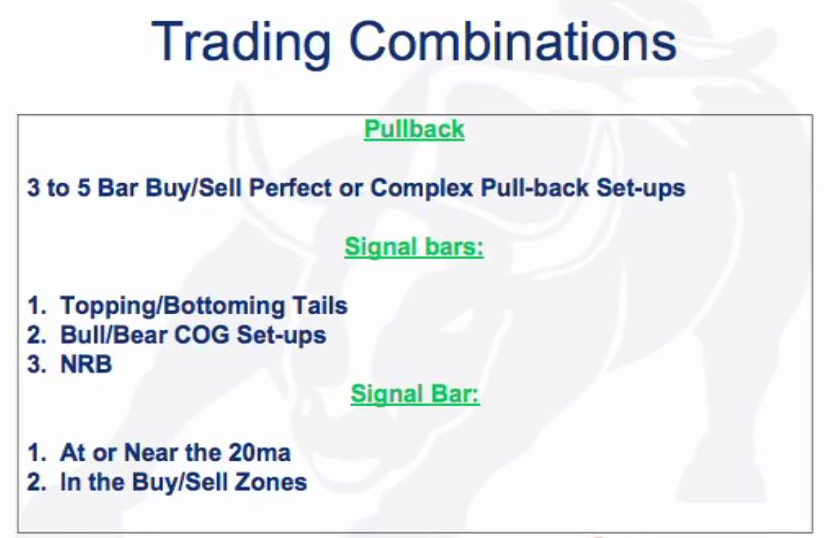
The BUY set up occurs when you see a 1) 3-5 bar, 2) Perfect or complex, 3) Pullback, 4) in an UPTREND
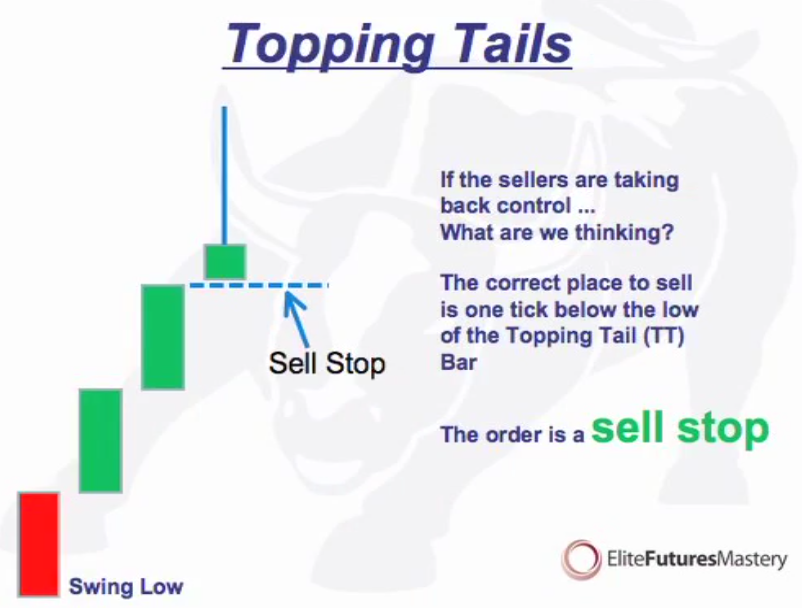
The SELL set up occurs when you see a 1) 3-5 bar, 2) Perfect or complex, 3) Pullback, 4) in an DOWNTREND
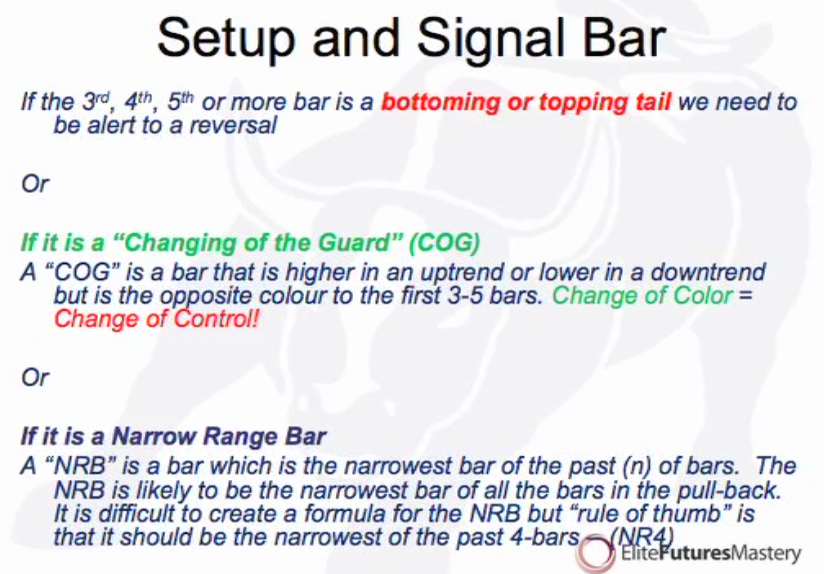
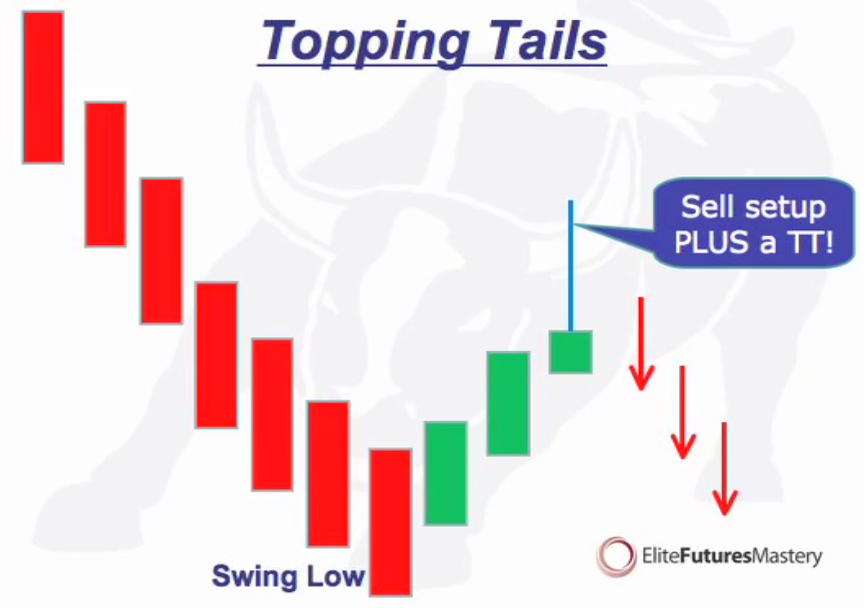
You’re looking for the tail that tells you that the sellers have come back and and trying to regain control of the market.
Coffee is one trade a year: Sell in the beginning of June and buy it back at the end of June. You want a breakdown at a major support level or close to it and you want to hop on the trade for as long as it tells you its still valid or until the market bottoms out and starts going sideways.
In an up-trend the pull-back should occur after a higher-high and in an down-trend after a lower low. After making a higher high the market must make a new low before the next high can be made or make a new high before the next low can be made.
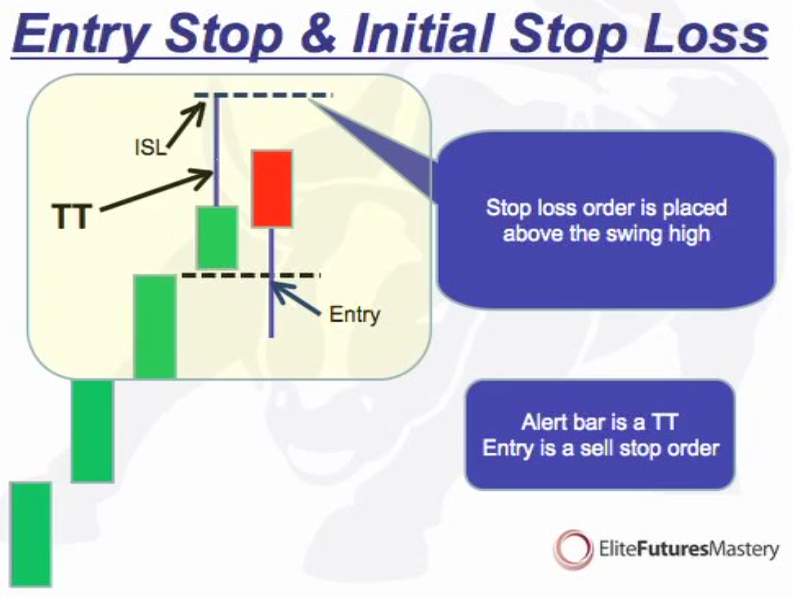
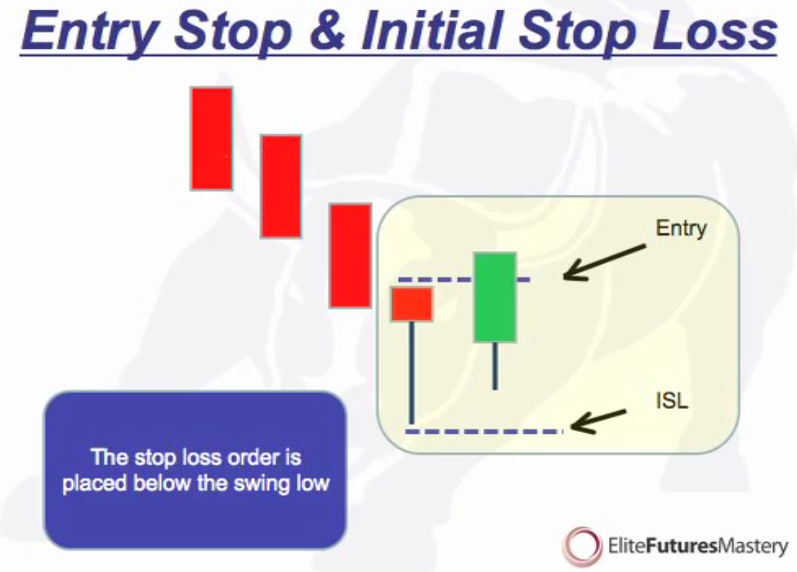
The only thing you can control is your exit but it is good to manage your stop losses.
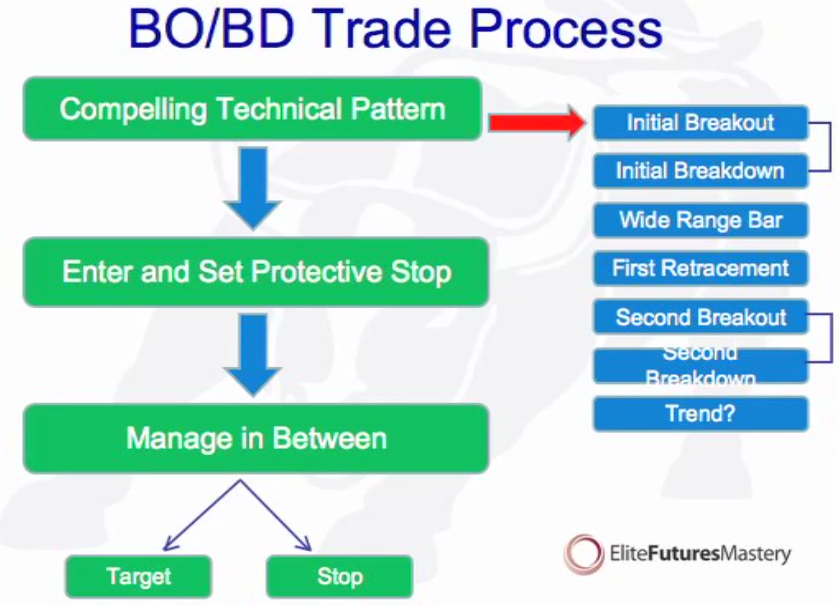
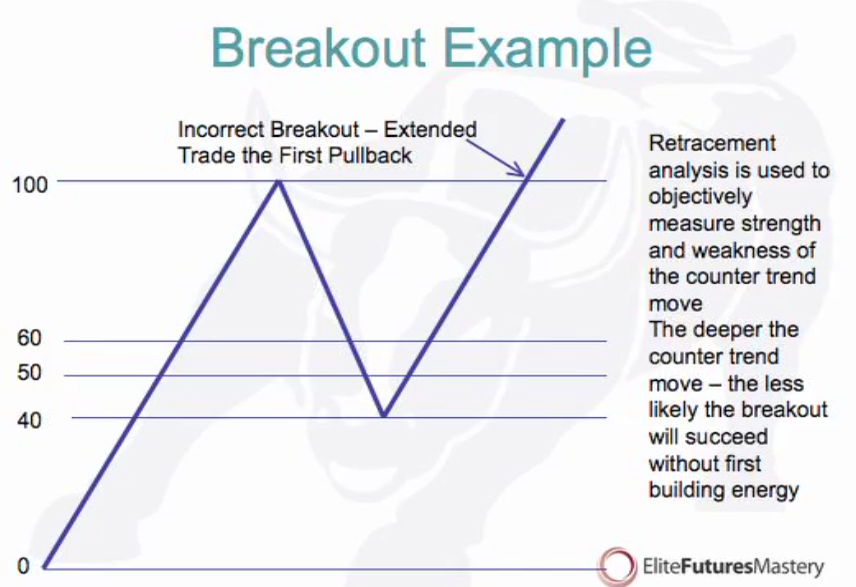
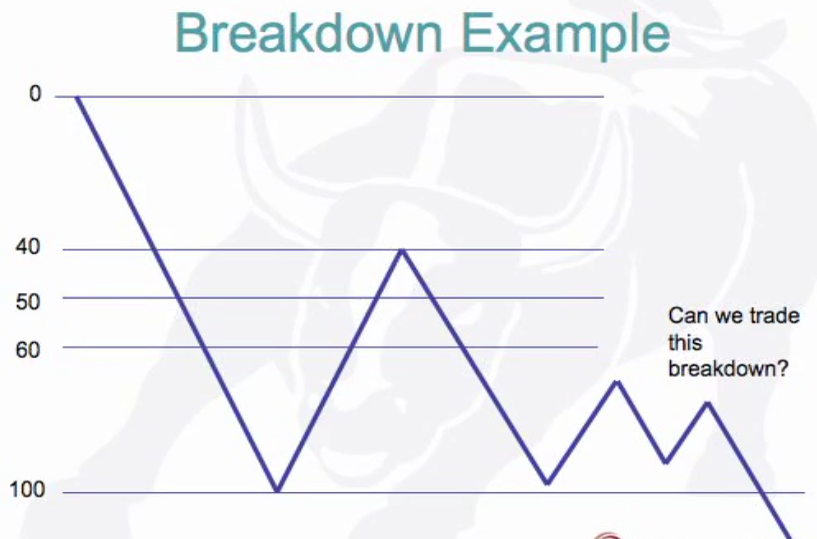
Break out and Break down processes. If you understand it please explain it to me. You need a compelling story and a predictable pattern.
Breakout Sequence: Initial breakout – price breaks above resistance after a consolidation. First retracement – Price retraces towards the initial breakout point and reverses on support. This is the safest entry point. Secondary breakout – Price moves aboce the initial breakout high (prior high) after consolidation (building energy) at the prior high.
This is a trade you can’t afford to miss.
Trade process: 1 – Manage risk. 2 – Capital protection. 3 – Taking profit.
Average True Range (ATR): The average range, high to low (plus gaps) of the past 10 bars. Multiply that figure by the point value. Tells you the normal dollar risk to expect in the next bar. Safety margin is twice the ATR.
A scratch trade is getting out at the break even stage where you will still pay a brokerage fee. Break even is getting out at a level where the brokerage is covered by a small profit.
Ends with about 2 hours of scenarios and live examples.
Words I didn’t understand or need to look up:
Supply squeeze.
Safe haven trade.
Puts.
Swing trading – https://www.asx.com.au/prices/gann.htm#Swing%20Charts%201
Gann swing – https://www.asx.com.au/prices/gann.htm
20 moving average (20MA)
Simple moving average, weighted moving average, exponential moving average.