Currencies trade in pairs. There can be 2 currencies but one exchange rate.
Example 1: Say American gives $1000 and gets $1250 Canadian dollars. Exchange rate is 1.25. Last year he exchanged $1500 Canadian to $1000 US. So the rate was 1.50. Which means the US dollar has weakened vs. the Canadian dollar.
Example 2: Woman moves to Canada. Exchanges 100,000 USD to 150,000 C$. Exchange rate 1.5. One year later she moves back and exchanges 150,000 C$ to 120,000 USD because the exchange rate dropped to 1.20. Profit = $20,000.
Leverage: Currency traders often use leverage of 100 to 1 or higher. Which means they could make the same profit with 1000 AUD. But they can make the same trade.
Differences between Forex vs. Stock/Futures Market
– Guaranteed stops.
– Strong, persistent trends.
– Superior leverage. (You decide how much or how little)
– Tremendous liquidity.
– No directional bias. (You can go long or short)
– 24-hour market.
Advantages of FX
Info about your currency is readily available.
Less complicated.
Ability to trade news, events.
Always open, never halted or limit-up.
Major Currency Symbols
EUR – Euro
GBP – Great Britain Pound
USD – US Dollar
JPY – Japanese Yen
CHF – Swiss Franc
CAD – Canadian Dollar
AUD – Australian Dollar
NZD – New Zealand Dollar
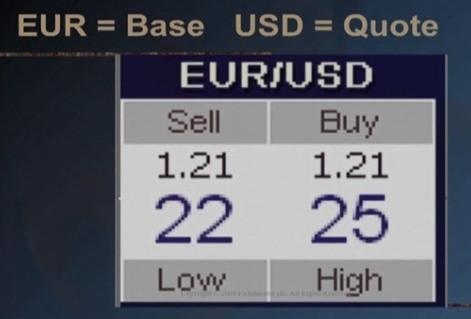
So in each pair the first member is called the base currency and the second is called the counter or quote currency. So when the exchange rate rises the base is strengthening vs. the quote. Vice versa happens and the base is falling while the counter is strengthening. So when you look at a chart it shows how strong or weak the base is moving to the quote.
Basics
Exchange rate is referred to as “the price”. So 1 Euro = 1.21 USD. So exchange rate is 1.21 and then carried out 2 more decimal places. 1.2125. The last digit is a PIP. 100 PIP is equal to $1000. So best way to remember that is 1 Euro = 1.2125 USD. So if the rate changes to 1.2126. Now if 1 POP – 1/100 of a penny and you use the leverage you get 1 PIP EUR/USD = $10
Spread
Every trading instrument has a buy and sell price. The difference between the two is called ‘the spread’. Most currencies offer a fixed spread. So think of spread = ‘cost of doing business’. Your job is to overcome the spread which is breaking even and then making a profit.
Terminology
Long – Profit from a rising exchange rate.
Short – Profit from a falling exchange rate.
Flat – No position in the market.
Entry – Point where you enter the trade.
Target – Goal for the trade.
Stop – Protection from loss.
Lot – 1 trading unit (Similar to a 100 shares or 1 futures contract)
Currency Nicknames
US Dollar – Greenback or Buck
British Pound – Cable or Sterling
Euro – Single currency
Canadian Dollar – Loonie
New Zealand Dollar – Kiwi

Eg 1 Euro = 1.2123 USD
1 USD = 109.42 JPY
1 GBP = 1.8057 USD
Trade Example
EUR/USD (S) 1.2122 x (B) 1.2125
So if you go long (buy) you’ll pay 1.2125. To break even you need the (S) @ 1.2125 and (B) @ 1.2128.
A 3-PIP move will compensate for the spread. See the trend continues and the trader exits at 1.2135 x 1.2138. (10-PIPs profit). This will net the trader $100 in a USD standard account or $10 in Mini account.
Value of a PIP
Determined by currency pair traded and exchange rate.
All currency pairs ending with USD have a constant PIP value or $10 in a USD standard account e.g. GBP-USD. All pairs ending with GBP will have a constant PIP value of 10 GBP e.g. EUR-GBP.
Most trades have a PIP costs column to know the value.
The Trading Day
The time of day is expressed in GMT because it’s a common point of reference.
E.g in a country it begins at 21:00 or 22:00 GMT depending on daylight savings.
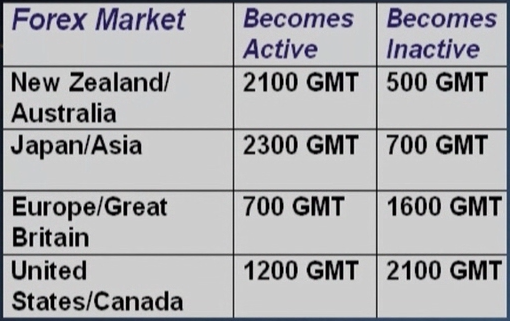
Active Trading Times
23:00 GMT – Morning in Tokyo (10% or all FX volume)
7:00 GMT – Morning in Europe, London (London = 30% FX volume)
12:00 GMT – Morning in New York (NY = 20% FX volume)
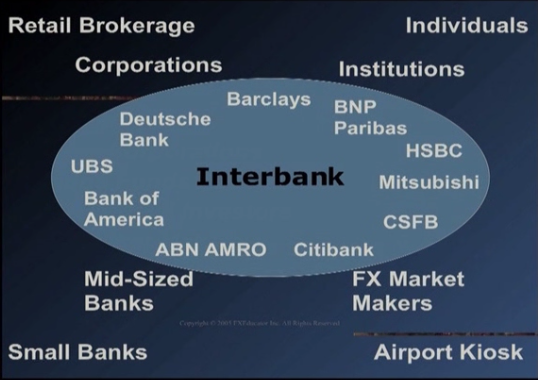
Participants
– Interbank: The heart of the forex market. 75% of trades. Trade through EBS (Electronic Brokering System)
– Major corporations: All staff don’t get paid in $s. They have to trade in foreign currency to buy stuff overseas.
– Hedge Funds: US wants Japan to deliver in 6 months so they eliminate currency risk by buying futures and going long or buying the currency (Yen) itself.
– Institutional Investors: If a company has 50,000 shares and an institution buys 10,000 shares, it is going to be of concern.
– FX Market Makers: Deal in millions or billions. Derive prices from the Interbank.
– Individuals: When you travel you exchange at a kiosk.
Central banks
Decide rates for the country. They may enter the currency markets to force exchange rates to favourable levels. As countries currencies strengthen, exports become more expensive. The bank of Japan has used this tactic to lower the value of Yen so that export is not too expensive. By weakening the Yen vs. USD, Japan protects it’s interest of exporters. Central banks will signal their intentions well in advance. Officials use ‘code phrases showing this. E.g. we are watching exchange rates closely, we will protect against sudden moves in the forex markets, exchange rates should reflect fundamentals. Jawboning: Mere hints of intervention creates the desired effect as traders rush to get on the same side as the bank.
Fundamentals
– You just need to know 3 words – FOLLOW THE MONEY
Capital Flows
– Huge amounts of capital are invested daily.
– Attractive investments draws capital from the world to the country.
– When capital flows out of a country, it creates supply and causes currency to weaken.
– When capital flows into a country, it creates demand and causes the currency to strengthen.
– Rising interest rates attract capital by making fixed income investments more attractive.
Example 1: US think Japan’s real estate market is undervalued. US sell their apartments to buy Japanese malls. So they get USD which they change for JPY resulting in capital flow to Japan.
Example 2: Hedge funds see hot stock in UK. They sell JPY and exchange for GBP. Result – Capital flows out of Japan to UK.
Example 3: Large global fixed income funds want higher returns and safety. They see UK is better so sell Euros for GBP. Capital flows to UK.
Trade Flows
– A balance of imports vs. exports.
– Supply and demand.
– Net exporter (Japan) vs. net importer (US).
– The importing country must pay with currency of the exporting country. So the importing country has to sell their own currency to currency of the exporting country.
Example: Since Japan is export-based it see a stream of capital flowing in while goods going to US will see a stream of capital flowing out.
Balance of Payment
– It’s a balance of capital flows and trade flows.
Example: Even though US dollar gets weakened by so much importing, it is offset by huge capital flows from Asian central banks investing in US treasuries. If this balance didn’t happen USD would collapse.
Interest Rates
– They have a major impact in capital flows and large pension funds want fixed income. Investors are looking for the best return and safety.
– If a market perceives rates will rase faster or fall slower than anticipated, the underlying currency strengthens. And if it perceives that rates will fall faster or rise slower than anticipated, the underlying currency weakens.
– The ones that are rising are more likely to attract capital flows.
Example: UK raises rates a quarter of 1% or 25 basis points. A fixed income fund in US looks less attractive so they sell US bonds and get USD, convert it to GBP and buy British bonds to take advantage of UK rates. Flow of funds out of US into UK.
– There are futures contracts tend to be reliable predictors of interest rates.
– In US Chicago Board of Trade (www.cbot.com) is a key indicator of benchmark US interest rates.
– To calculate take 100 minus the price quoted = average interest rate for month traded. So Feb contract settled at 95.995. 100 minus 95.995 = 4.005. Predicting an average rate of 4% for Feb. Same for Eurex.
Economic Indicators
– Employment, manufacturing, sales, inflation, GDP, Consumer confidence. Altogether they give a perception of the health of an economy.
– If they come out stronger than expected it’s a sign of economic strength. But the side effect of a strong economy is inflation. To fight inflation banks raise interest rates. Higher rates attract investors causing the currency to strengthen. While weaker indicators are signs of economic weakness so central banks lower interest rates to boost the weak economy which repels investors causing the currency to weaken.
– Many traders mistake looking at the ‘headline number’ ignoring underlying components. Puzzling traders the markets reaction at times. Say traders a looking at the headline number for payroll but it doesn’t show all jobs, the ‘knee-jerk reaction’ has already costed the traders. If unemployment rate falls it means pool of workers is shrinking > creates pressure to increase wages > leads to inflation > central banks fight inflation by raising interest rates. Negative correlation where unemployment rate goes the opposite way vs. the hourly earnings.
Currency Characteristics
– USD: 90% of all Forex trades involve USD. $12 trillion GDP. Most liquid fixed income and equity markets in the world. Absorbs 70% of worlds savings. Nearly $700 billion trade deficit so it needs $2 billion capital inflows everyday to compensate. Inverse relationship with gold. USD falls when gold rises and vice versa.
– GBP: World capital of Forex trading. High volume of UK trading hours. Energy production is 10% of the UK’s GDP so strong correlation to energy prices. European nations account for over 50% of trade with UK.
– Euro: 25 countries, 12 of which use Euro. (EMU – European Monetary Union). Positive correlation with gold. Largest EMU members are Germany, France, Italy.
– Canadian Dollar: World’s 5th largest producer of gold and 14th largest producer of oil. Tends to rise when commodities rise. US purchase 85% of their exports. Budget surplus and trade surplus so they have a very healthy bottom line.
– Japanese Yen: Export driven economy. Bank of Japan often intervenes in the currency markets to keep Yen weak so exports are affordable. Little energy production and negative correlation to energy prices so if oil prices are rising it can hurt the Yen.
– Swiss Franc: Physically small but financial giant. 35% of worlds wealth management takes place in Switzerland. Home to major banks. ‘Safe haven’ currency due to political neutrality, rises during times of political uncertainty.
– Australian and New Zealand Dollars: Both are commodity currencies so they rise with commodity prices. Positive correlation with gold and metals. Both export agricultural products and are sensitive to droughts and severe weather.
Fundamental Strategies
– We know traders monitor gold and oil prices to predict movements in specific currencies. So if oil price rises, JPY falls and CAD rises. If gold prices rise, USD drops and NZD, CAD, AUD, CHF will rise.
– Japan is the worlds 2nd largest net oil importer so they feel it when oil rises. Canada produces oil so they have positive correlation. So the CAD/JPY currency pair is a good proxy for oil prices.
– Gold has inverse correlation to USD. Gold is considered the ultimate safe haven investment especially in times of uncertainty just like Swiss Franc. AUD and gold has 80% positive correlation. Canadian$ is 60%. New Zealand$ is 50%.
– EUR/USD and USD/CHF have a strong inverse correlation. So they are often used to hedge one another.
– Merger Acquisition (M&A) deals means potential for strong upward movement in the target corp’s domestic currency, relative to the acquirer’s domestic currency. Remember this is if it’s an all-cash transaction and not if it’s all-stock transaction.
China
– China’s Yuan was pegged to the USD at a rate of 8.3. So they moved up and down in tandem.
– China keeps it’s currency artificially weak to make exports more attractive. Also gives China an unfair trade advantage over competing countries. After being contested China unpegged themselves and let their currency appreciate. Yuan is now pegged to a basket of foreign currencies. So not it’s major weighting is USD, Euro, JPY, S. Korea Won. Minor weightings – GBP, Singapore$, Malaysian Ringgit, Russian Ruble, AUD, Thai Baht, CAD. USD/JPY fell 300 pips on the day of announcement. USD/JPY daily volatility is usually 100 pips.
Hey folks, it’s Paras!
If you have a request to see a tech product, summary on personal development or want a custom design for clothing and merch … Please do let me know through the links below.

Join me or support my work
💌 Monthly email summary
▶️ YouTube | TikTok | Instagram
👍 Facebook | X | Blog
🎤 Podcasts: My Stories | Self Growth
Other links:
💰Get $25 of FREE Bitcoin
☕ Buy me a Coffee
🛒 My Amazon
👕 My Merch
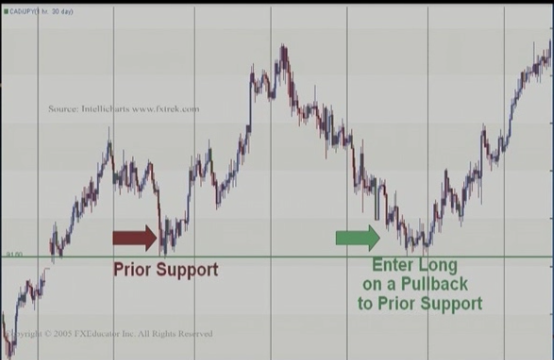
Multiple Time Frame Stategy
– Identify opportunities using long term charts and pinpoint entries using short term charts.
– If the pair is trending higher then you’ll only take long trades and if lower then short. And no trade if there is no trend.
– One the trend is identified, switch to the hourly chart to determine entry point. Go long on the uptrend if price falls to a level of support on hourly chart or oscillators indicate that the pair is oversold. Downtrend – reverse for short trades.
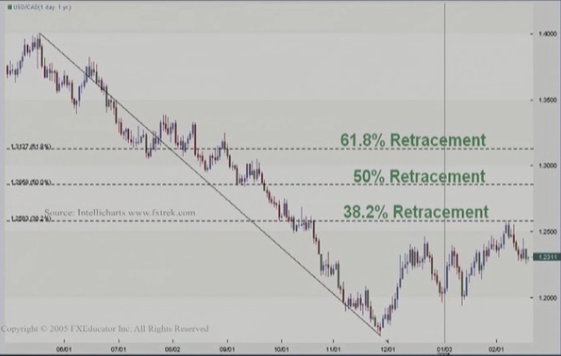
Fibonacci Method
– Most important rations are 38.2%, 50%, 61.8%
– Meausure a trend from peak to trough or vice versa. Then insert key retracement ratios (above percentages).
– Because they’re in so many fibonacci patterns in nature so traders believe in it.
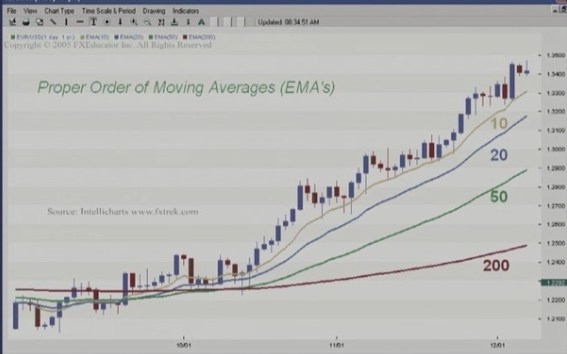
Trend Method
– Look at the ‘proper order’ of moving averages. Institutions use 10-day moving averages. So 10-day EMA (exponential moving average would be above or more than 20 EMA and 20 would be more than 50EMA and that would be more than 200 EMA. Or reverse order for downtrends.
– In this case you’ll enter long and place a stop equal to half of the daily 14-period ATR (Average True Range). Then raise the stop every time the candle closes constantly keeping a distance to half or 14 ATR. Do not lower the stop EVER. And of course reverse for shorts.
Disk 2 Part 1
These parts were getting too complicated for me without doing it practically so I stopped taking notes.
Look up the following if you’re interested:
– The Elevator Method
– The Detective
– Pivot Point
– Breakouts
– Triangles
– The “Carry” Trade
Risk Management
– Consider yourself as a risk manager first. Think of trading as surviving first.
– If you have a bad trade just cut your losses and move on. Take responsibility and make sure you limit your loss.
– Winners vs. Losers ratio should not be focused on. You can lose small frequently and make your large winnings.
– Psychologically you’re wired to get out soon as you are winning. It may feel good but it’s counter-intuitive.
– Never double down or average down or add to the trade. It’s dangerous and habit forming.
– Beware of gurus and do not go on gut instincts. Analyse and use logic.
– Have a maximum loss rule where you have a percentage of the account value that you’re happy to lose. That way one bad trade wont damage the account. Or no more than 3-5 positions at a time.
– Set goals so you can see your monthly gains. Set modest achievable goals.
– Have a plan. Definite exits, where to place stops, etc.
– Pep talks about – Long term vs. short term trading. Position size. Risk/Reward ratio. Consistency. More than one technique can be used.
5 Stop Placement Methods
(Always use STOPs on every trade and never ‘loosen’ a stop. Always reject trades that create too much risk.)
1. Monetary: Most widely used and least effective method. 30 pip stop or how many pips away. So it’s an amount of money, pips or percentage. Only use when you don’t have any other methods.
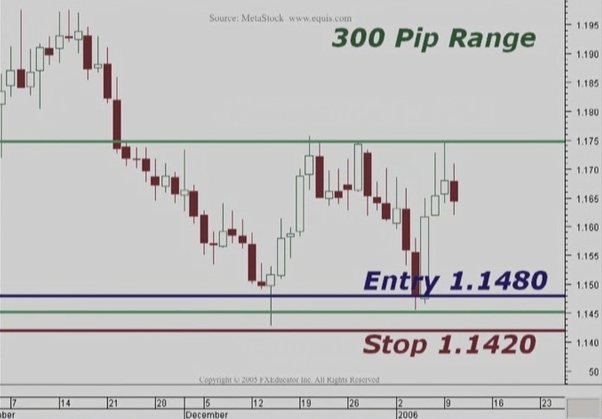
2. Support & Resistance: Measure between support and resistance and place equivalent of 10% beneath support. Reverse for resistance.
3. Volatility: Measure the volatility for the time frame being traded. Indicators such as ATR or Bollinger Bands. It increases the changes that your stops will not be hit.
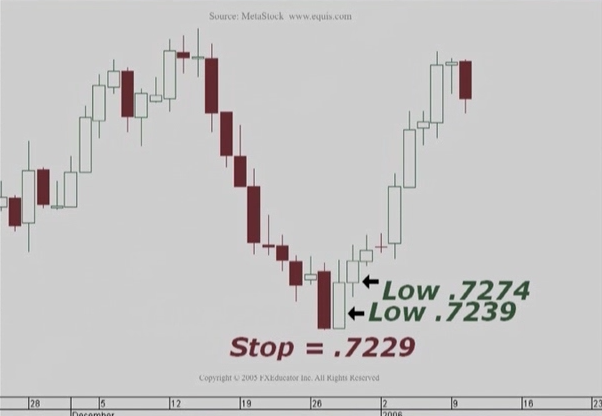
4. “2-Bar Charlie”: Place stop 10 pips beneath the low of the two most recently closed candles or bars. As next candle closes you recalculate the low or the two most recently closed candles. Choose the lower or the low. Reverse for shorts.
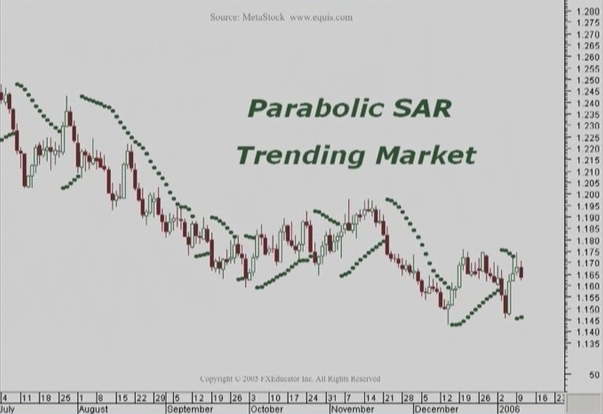
5. Parabolic SAR (Stop & Reverse): It tells you where to enter, where to stop and where to exit. It gets calculated.
Resources:
– www.FXStreet.com
Disk 1
01 Forex Foundation.avi
02 Market Structure.avi
03 Foundamentals.avi
04 Questions and Answers.avi
Disk 2
01 Tehcnical Strategies.avi
02 Risk Managment.avi
03 Putting It All Together.avi
04 Stop Placement.avi
Hey folks, it’s Paras!
If you have a request to see a tech product, summary on personal development or want a custom design for clothing and merch … Please do let me know through the links below.
Join me or support my work
💌 Monthly email summary
▶️ YouTube | TikTok | Instagram
👍 Facebook | X | Blog
🎤 Podcasts: My Stories | Self Growth
Other links:
💰Get $25 of FREE Bitcoin
☕ Buy me a Coffee
🛒 My Amazon
👕 My Merch